Your SentiSum Survey dashboard is designed to highlight reasons why your average rating and sentiment has increased or decreased.
Sentiment
Sentiment is shown as a percentage and based on only the written responses to the survey questions:
Sentiment (%) = (No. of Positive Mentions / No. of Overall Mentions) * 100
Sentiment Charts
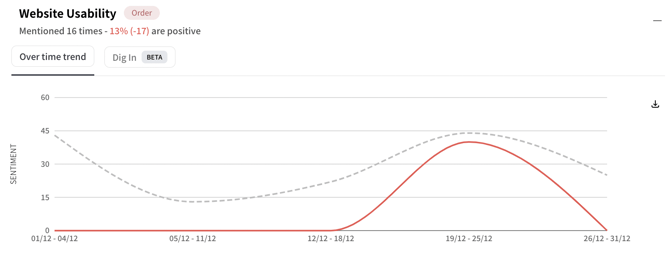
When looking at the chart for a particular AI tag such as Website Usability, you will see the volume of survey responses that mentioned Website Usability as shown by the grey bars. You will also see the sentiment of all the mentions of Website Usability as shown by the line.
Here, when we look at the last week, we can see that there were 16 survey responses that mentioned Website Usability, and 13% of them were positive mentions. The sentiment of Website Usability also decreased by -17 compared to the previous week.
Historical Trend Charts
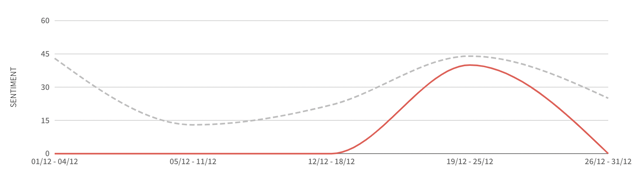
In the example above, we can see that when selecting the last week of data, this is represented in the graph, and the previous 4 weeks are in the first 4 trending lines. This is so that we can compare recent changes in a longer-term context.
For example, this sentiment decrease of -17 might seem serious. However, looking at the historical trend over the last 3 time periods, we can see the Website Usability sentiment has steady fairly steady over the last 3 weeks and could indicate a less serious problem and was bumped suddenly in 4th week which needs to be focused and worked upon.
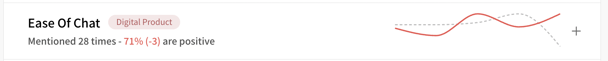
Sentiment Line - Green, Grey, Red
When the latest change is an increase, the sentiment line is green because sentiment increases usually have positive consequences.
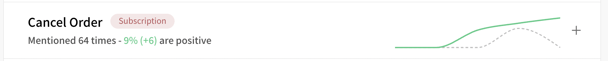
When there has been no change since the previous time period, the sentiment line is grey.
When the latest change is a decrease, the sentiment line is red because sentiment decreases usually have negative consequences.