
Your dashboard is built to quickly identify rises in support tickets. Isolating the important rises in issues in a timely manner is crucial to staying in control of contact volume.
Summary - Top Increases
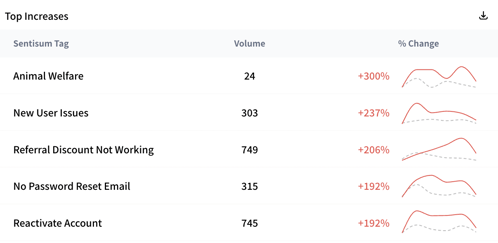
On your Support dashboard, you can see the five Top Increases for the dates selected, based on the % change compared to the previous date range. For example, here we can see New User Issues results in spikes every couple of weeks in volume. However, Animal Welfare, although mentioned less, is usually a predictable volume but has recently increased by 300% in the last week.
Daily digests
An even quicker way to check daily for Top Increases is through daily digests. These are emails sent to your inbox at 9am every morning detailing the Top Reasons For Contact, as well as the Top Increases and Decreases for yesterday's contacts.
Daily and weekly reviews of increases
In Summary, switching between Yesterday, Last Week, and Last Month on the date range filter, can show you the daily, weekly, and monthly trends in Top Increases and Top Decreases. This will help to see if a recent increase was just a blip, or whether it signals a more gradual and long term rise in an issue.
Anomaly detection
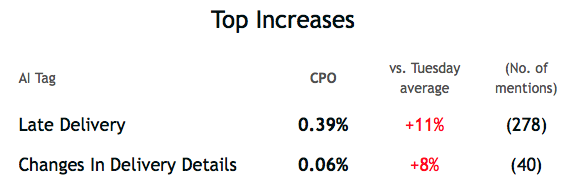
Your SentiSum dashboard can also provide alerts for when AI tag volume goes above what our analytics predicted would be normal behaviour; when AI tag volume for the day is classified as an anomaly. Please get in touch if you would like to know more about these alerts.