Guide to Using Advanced Filters
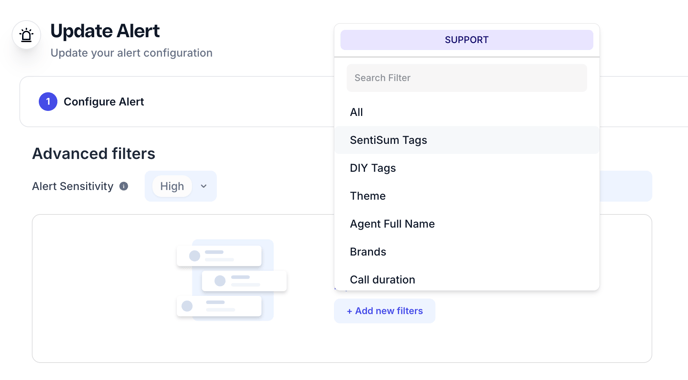
Advanced filters provide a powerful way to refine anomaly detection by focusing on specific data patterns and thresholds. This guide explains how to use these filters effectively, covering their key components and functionality
1. Setting the Alert Threshold
Alert thresholds controls how anomalies are detected, with three preset levels:
- Low:
- Detects even small changes in the data.
- Use this for scenarios where subtle deviations matter.
- Medium:
- Balances detection, flagging moderate changes without being too lenient or strict.
- Best for general-purpose anomaly tracking.
- High:
- Flags only significant changes in data.
- Ideal for focusing on major deviations while ignoring minor fluctuations.
Choose the sensitivity level that aligns with the importance and frequency of changes in your dataset.
2. Volume Threshold
The volume threshold sets the minimum amount of data required for an alert to be triggered.
-
What It Does:
Ensures alerts are only generated when there’s enough data to confirm a true anomaly, filtering out insignificant events. -
How to Adjust It:
- A low volume threshold (e.g., 1 or 2) triggers alerts even for small datasets.
- A high volume threshold limits alerts to large datasets, ensuring only impactful anomalies are flagged.

3. Adding Filters
Filters allow you to narrow down the data used for anomaly detection so you can focus on specific metrics, dimensions, or conditions.
- Steps to Add Filters:
- Navigate to the Advanced Filters section.
- Click Add Filter and define your criteria (e.g., region, product category, or time range).
- Save and apply the filters to tailor your alert view.

4. Importing Filters
If you have predefined filters saved on the dashboard, you can import them for use within the settings.
How to Import Filters:
- Go to the Advanced Filters section.
- Click the Import Filters button.
- Select the filters you want.

Results and Examples
Once you've configured your advanced filters and thresholds, the anomaly detection system uses these settings to monitor your data and generate alerts only when genuine issues occur. Here are some detailed examples to illustrate how different setups affect the alerts you receive:
Example 1: Low Alert Threshold with a Low Volume Threshold
- Setup:
- Alert Threshold: Low
- Volume Threshold: 3
- What Happens:
The system picks up even small changes in your data. If there are 3 or more tickets for the issue and it shows a minor deviation, an alert will be triggered. - Real-World Scenario:
This is useful when you want early signals for emerging trends—such as subtle shifts in customer behavior—so you can act before small issues become larger problems.
Example 2: High Alert Threshold with a High Volume Threshold
- Setup:
- Alert Threshold: High
- Volume Threshold: 20
- What Happens:
Only major deviations in the data, represented by a z-score of 7 or higher, will trigger an alert. Additionally, alerts will only be sent if there are atleast 20 tickets for the issue, ensuring the change is statistically significant. - Real-World Scenario:
This configuration is ideal when monitoring critical metrics—such as a delivery issues customer complaints around product quality—where only large, impactful changes should warrant immediate attention.
Example 3: Filtering by Specific Dimensions (e.g., Region)
- Setup:
- Filter Criteria: Region = North America
- Alert Threshold: Medium
- What Happens:
The system focuses exclusively on data from North America. With medium threshold, it filters out very minor changes but flags moderate deviations that could signal important regional issues. - Real-World Scenario:
If your business operates globally, applying a regional filter allows you to hone in on anomalies affecting North America, helping you quickly identify and address issues specific to that market.
Example 4: Combining Multiple Filters for Targeted Monitoring
- Setup:
- Filter Criteria: Region = Europe, Product Category = Electronics, Time Range = Last 7 Days
- Alert Threshold: Medium
- Volume Threshold: 5
- What Happens:
The system narrows its focus to anomalies occurring within Europe, in the Electronics category, over the past week. Alerts are triggered only when there are at least 5 tickets and the data shows a moderate but significant deviation. - Real-World Scenario:
This setup is perfect for targeted analysis when you want to monitor specific segments or product lines. It helps filter out unrelated data, so you only receive alerts that are directly relevant to your strategic interests.
By tailoring your sensitivity levels, volume thresholds, and filter criteria, you can fine-tune the anomaly detection system to provide the precise insights your business needs—ensuring you’re alerted only to the most impactful changes.
