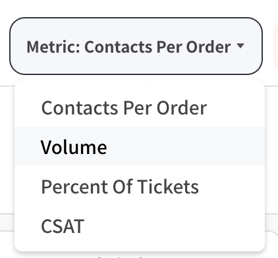
Every team wants to see their data in a different way. Here, you can choose which metric to see your ticket data through.
No. Of Tickets
The number of tickets that include a SentiSum Tag, or the number of tickets that meet certain filter criteria
% Of Tickets
The % of the total number of tickets in the selected date range that include a SentiSum Tag or meet certain filter criteria
E.g. if you have 4,883 tickets in a day, and you see late delivery was mentioned in 99 tickets, this will show as 2%
Contacts Per Order
If you want to integrate your order data (no. of orders per day), you can look at the amount of contacts you received when compared to the number of orders. This metric is the best to control for fluctuations in business growth or daily order volume so that you can see if the increase in tickets is due to an increase in orders, or a true increase in the prevalence of an issue. This can also work for other metrics such as contacts per deliveries or contacts per new users.